Hello everyone and welcome in for another article, this one talking about identifying upside in our fantasy drafts. Before we jump in, be sure to check out the Apples & Ginos community on Discord and the Apples & Ginos Patreon for even more content; I’ll be providing extras for Patreon members all summer and right now you can get in that group for a mere $1/month. I’m also in the Discord every day and would be more than happy to answer any questions you have about asymmetry, mellifluous, or any other words I use in a desperate attempt to make myself sound smart.
Before I get started I want to apologize for the obnoxious terminology here. I strive to make all of my content as accessible to everyone as possible, and I am well aware that “asymmetrical upside” is both a mouthful and a wildly ostentatious way to describe an aspect of fantasy draft strategy. However I chose to use the term “asymmetrical upside” here for a couple of reasons. The first is that “asymmetrical” is in fact the correct term used in statistics to describe the probability distributions that I’ll be discussing in this article. The second is that this term is commonly used in advanced fantasy football circles and fantasy football is lightyears ahead of fantasy hockey in its application of statistics (and dare I say even general critical thinking) to the game. The fantasy hockey community has long enjoyed a loose relationship with optimal strategies and in my experience has also been somewhat resistant to new ideas born out by studies and the like. But that’s where a more advanced player (like yourself if you’re reading a fantasy hockey article posted in July more about math than player analysis) can find an edge in the average league.
What is Asymmetric Upside and How Does It Apply To Fantasy Hockey?
Asymmetrical upside is about assigning every player a range of probabilistic outcomes and then identifying which players are currently being projected below the mean (average) of their potential range of outcomes. Here are three graphs of probability distributions:
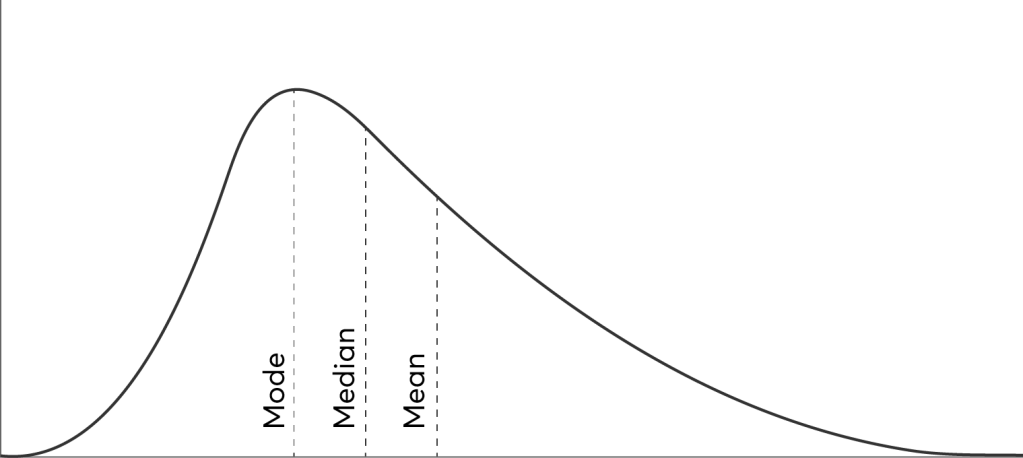


You can think of each step along the x-axis of this graph as a different outcome for that player (a certain number of goals/assists/points/shots/hits etc). Closer to zero are the non-desirable outcomes or lower statistical totals, and closer to the end of the x-axis are the absolute best case scenarios. Along the y-axis you have the likelihood of that outcome becoming true in the upcoming season. The line in the middle of each graph can be thought of as that player’s projection for the season, be it mine or Yahoo’s or whatever source you might use. So in graph #1 we see a player who seems most likely to have non-desirable outcomes, in graph #2 we have a player who has an equal amount of non-desirable and desirable outcomes on either side of their projection, and in graph #3 we see a player who seems most likely to have desirable outcomes and outperform their projection.
To make things even more clear, I would say that the majority of players who have played in the league for some number of years have probability distributions that look similar to graph #2 (albeit placed in different spots along the x-axis). For example both Nathan Mackinnon and Adam Lowry are “predictable” players with a relatively narrow range of outcomes. Because we’ve observed them perform very similarly year after year, it’s reasonable to think that we can accurately predict their 2022-23 season and that any variance from that baseline will be fairly minor. Of course even Mackinnon’s worst-case scenario far outstrips Lowry’s best-case, but both of their probability distribution will look very similar to graph #2 – evenly distributed on either side of their projection. It will be hard for any fantasy manager to get an edge based on drafting these types of players, as generally they are correctly assessed to be predictable players and therefore their draft day value is likely very close to their end of season value to your roster.
So Where Is The Value?
Where there exists a possibility for gaining an advantage are in the types of players with asymmetrical distributions where the player’s projection (and generally therefore their average draft position or ADP) does not accurately take into account the probability that they will significantly outperform or underperform that projection. A great example of this on the negative side is Tyson Barrie from last season. I and many others projected Tyson Barrie for a monster season; he appeared to be set to quarterback the top PP in Edmonton all season long and benefit from Connor McDavid and Leon Draisaitl’s greatness. But in hindsight, this outcome was in perhaps the top 10% of his probable outcomes. Think of it this way: when projecting a defenseman to have a 70+ point season who hasn’t consistently done that previously and in a similar situation, the possibility of him outperforming that lofty projection is very low. But the possibility of him underperforming is very high just by virtue of where you’ve set the bar. I did not account for the possibility that Barrie might not be the top PP quarterback all season in my projections, and that eventuality instantly lowered his potential for fantasy. I also projected Barrie for significantly more even strength time on ice, but he became such a liability (at least in the eyes of his coaches) that he saw less than 15 minutes of total ice time several times throughout the season, which again lowered his potential output. Barrie also performed significantly worse than I thought he would in the “luck metrics” of individual points percentage, shooting percentage, and on-ice shooting percentage than I thought he would which once again brought his point totals down from my projection.
I’m less concerned with the actual projected number of points I assigned to Barrie, and more with where I was recommending people take him in drafts. I’m still not sure if I was wrong to project Barrie for top PP and the amount of ice time I did, as it seemed like the most probable outcome at the time. The object of a projection is to capture the most probable outcome; the object of a draft ranking is to assess that projection versus that player’s range of outcomes and come to a conclusion about their relative value to your team in a draft environment. Put more simply, a projection is an attempt to predict the most likely outcome while a draft ranking is an attempt to take into account all possible outcomes. The trick for me as an analyst is that I can’t offer perfect draft rankings for every format and every league’s scoring settings, but I can build projections based on what I believe is the most likely outcome for each player. Could I build low and high projections alongside my already-existing median projections? Sure, but those are still just numbers that don’t tell you how probable one is versus the other. My current idea is to add a slider to my projections showing whether I believe the player has asymmetric upside or downside from my median projection. In this case -2 could mean significant downside variance is probable, -1 could mean some downside variance is probable, 0 could mean variance is symmetric around the projection, +1 could mean some upside variance is probable, and +2 could mean significant upside variance is probable. This is still obviously an inexact way to describe asymmetry, but at least I could give some warning to those using my projections and looking at whoever this season’s equivalent of Tyson Barrie will be.
You might have reached this point in the article and grumbled to yourself “OK but what’s the big deal? Sounds like this whole asymmetric upside shtick is just a fancy way of saying ‘draft players who could do better than their projection’.” In a lot of ways, it is. But I think it is very helpful to a) visualize the potential outcomes of each player as a range rather than a single number projection, and b) identify what factors contribute to asymmetry in a players’ potential outcomes.
The Factors
The factors I weigh most heavily when considering if a player has asymmetrical upside are age, advanced stats, and time on ice (especiallly power play time on ice). I’ve drilled this point in countless articles and podcasts but a 15-minute-per-game player who gets bumped up to 18 minutes a night is now playing the ice time equivalent of one extra game every five games. That difference is astronomical in terms of point scoring upside over the course of a full season. Jakub Vrana is a terrific example of this type of TOI-based asymmetrical upside – he’s shown he can be productive in limited ice time already. If he was consistently promoted to the top PP unit and saw that jump up to the 18-minute-per-game level, he would be very likely to vastly outperform his draft position. This is the type of swing to take in the later rounds of your drafts over that stable veteran who won’t move the needle for your fantasy squad (looking at you, Nicklas Backstrom). So in those mid-to-late rounds of your drafts be on the lookout for players who have a reasonable path to more ice time, whether it be through their talent level or through teammates higher up in the lineup that may not have a firm grasp on their roles.
Statistics and advanced statistics are another way to identify players with this kind of upside in their range of outcomes. Sometimes players will take a step forward in terms of their advanced statistics but their “luck metrics” happen to be very poor in that season and it’s easy to see a path by which they outperform their career averages to date via simple regression to the mean of those luck metrics. Sometimes players have established a baseline where they seem to consistently underperform their advanced statistics, but the upside is that they have a bit more luck this season and cash in on more of those chances than they have in the past. Nazem Kadri is a terrific example of this type of scenario from this past season. It’s several orders of magnitude more difficult for a player to improve their chance generation far above their career averages than it is for a player to “get lucky” with a high shooting percentage or individual points percentage. When you take a player who usually generates a lot of chances, you only need the luck portion to break right for them to have a truly difference-making season for your fantasy team. We’ll see where Andrei Svechnikov lands in drafts this season, but he is likely going to be a player who projects to have relatively low ice time (for a player of his caliber) and relatively low chance conversion numbers. If either of those things trend upwards for him in 2022-23, Svechnikov could significantly outperform his projections and if both hit, Svechnikov could be this year’s breakout star a la Kadri from last season.
The last portion of the puzzle to consider is age. The vast majority of breakouts happen for players who are in their first few seasons in the league. Some come out of nowhere, like Tage Thompson for the Buffalo Sabres. Others trend positively through their first season or two without truly breaking through, like Jack Hughes. But the common thread for many of these breakouts is age, or perhaps more accurately number of NHL seasons played. Perhaps this is a topic for a future study to truly put hard numbers to this thought, but my general experience in poring over years of NHL data at the individual player level is that if a player doesn’t break out in their first three seasons in the league, they are unlikely to break out at any point. So we can see that a breakout is more probable for a player heading into their first, second, or third NHL season and we should ascribe them some amount of potential upside as a result. I would say that someone like Alexis Lafreniere who has put together two full seasons of very mediocre counting stat and advanced stat production on a per minute basis is not a great candidate to break out – because the single-season breakout would have to be one of the greatest ever seen for him to get from his current levels to a place where he would be an impactful asset for fantasy. So don’t blindly chase age as a solo benchmark for upside; it needs to be accompanied by some baseline of projectable production. Jack Hughes’ 2021-22 season was a great example of this because his previous production was solid but not spectacular and he only needed to take that last step of improvement and be a little less unlucky to become a break out star for fantasy.
Summarize This Article Please
In summary, asymmetric upside is a fancy way of describing players who appear to have a strong probability of outcomes that exceed their general projection. This can aid and improve how we think about and value different players by opening our minds to more than a single projected outcome. While the concept itself can be reduced to “draft players with upside” in theory, the how of 1) identifying what that upside looks like, and 2) estimating how probable that outcome is, really defines asymmetric upside as a player performance theory. Examining players based on the three factors of age, advanced stats, and time on ice will allow us to assess as accurately as possible how much potential upside an individual player has and make a judgement call about how probable those upside outcomes are. That judgement call is the source of most fantasy hockey player-based offseason arguments, and where great managers can separate themselves from the merely good. It’s a fine line, but one that makes the game fresh every year and keeps us coming back for more.
That’s all for this one folks, I hope you had as much fun reading it as I had writing it! Make sure you follow Apples & Ginos on Twitter and join the Apples & Ginos Discord server for more content and to ask any fantasy hockey questions you may have.
Thanks for reading, you are appreciated!
Nate
Soundtrack to my writing: Californian Soil – London Grammar
Distribution Images From: https://getnave.com/blog/frequency-distribution-types/
