Hello everyone and welcome in for another article, this one examining my 2021-22 projections to see how accurately I was able to predict player performance for this past season. Before we jump in, be sure to check out the Apples & Ginos community on Discord and the Apples & Ginos Patreon for even more content; I’ll be providing extras for Patreon members all summer and right now you can get in that group for a mere $1/month. I’m also in the Discord every day and would be more than happy to answer any questions you have about projections, Microsoft Excel, or anything else I spend hours staring at every day.
I’ve been putting out free projections for the fantasy hockey community for the past couple of seasons, but I had never actually vetted my own process with any sort of quality check. It’s easy enough to compare my projections to how the players actually performed, but we know there will be some significant differences so how do I check my own work to ensure I’m providing something of real value?
I came up with two questions that I should be able to answer affirmatively if my projections are providing value. The first is a little bit subjective: “Do these projections identify some breakout values?” My projections had me high on Drake Batherson, Filip Forsberg, Jeff Skinner, and Sam Bennett (among others), and those players formed significant parts of my fantasy rosters this past season. There were certainly misses as well, but being higher than market on those players was like having a small step on the competition this past season out of the draft, and these kind of little edges just add an extra couple percentage points on our chances of winning that championship.
The second question I asked myself was much more objective: “How do my projections measure up against the best projections out there?” For this I compared my projections directly against those published by Dom Luszczyszyn of The Athletic. Dom is widely considered one of the smartest people in hockey and he uses models to consistently win money betting on hockey games. So I figured rather than simply comparing my projections against the players’ season-end statistics, I could compare how far off I was on average versus how far off Dom was on average and see if I was even in the same ballpark.
So to be clear, I compared my projections for each player against their actual statistics and found the absolute difference for each statistic, whether I was higher or lower than the actual. I did this for each statistic that both Dom and I projected, which was goals, assists, points, power play points, shots on goal, hits, blocks, penalty minutes, and average time on ice. To ensure I was comparing apples to apples, I did this on a per game played and per 60 minutes of ice time basis rather than an overall finish. Dom’s projections were built assuming 82 games played for each player where I varied my projections with some games played projections included (essentially functioning as a proxy for perceived injury risk). Running this comparison on a per GP or per60 basis makes up for that difference; you could obviously multiple the per GP numbers by 82 to get the overall numbers if you wanted.
I ended up with this spreadsheet (posting for the people deeply concerned with the numbers):
And for the more sane people less interested in wading through seven tabs of statistics, here are the outputs:
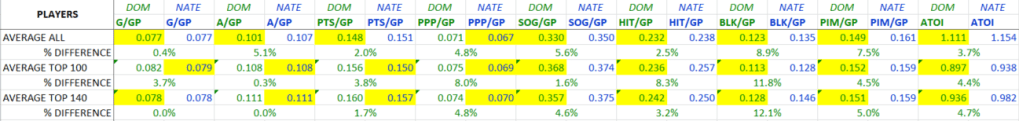

The results were quite consistent between the per GP and per60 comparisons. I’ve highlighted the lesser (and therefore closer to the actual player finish) number in yellow for each statistic. Dom’s numbers are all in green and mine are all in blue as you can see. The % difference number shows the difference between Dom and I for each statistic (regardless of who was closer to the actual player finish). I checked these values for all of the players that we both projected, the top 100 players in my projections, and the top 140. These are largely arbitrary numbers but obviously the top 100 players are likely the most fantasy-relevant, while I chose 140 as in a standard 10-team Yahoo league most teams would be rostering 14 skaters (10 x 14 = 140).
So what do these numbers tell us? Across all the players we both projected, Dom was (predictably) more accurate than I was, but I was happy to be within 6% of Dom’s numbers across the major fantasy categories (G/A/PTS/PPP/SOG) and hits as well. I managed to outperform Dom slightly on PPP, but clearly I need to re-evaluate my process for projecting blocks and PIM as they were my furthest off the mark.
I was very excited to note that in my top-100 skaters I outperformed Dom in G/A/PTS/PPP while giving up SOG/HIT/BLK/PIM. This trend held but moved more towards Dom’s side when I looked at the top 140 skaters. I think most fantasy managers would prefer to have the most accurate projections for those crucial points categories, so it’s a great sign for my process that for these two sub-groups (encompassing the most important fantasy players) I was able to slightly outperform Dom’s projections in G/A/PTS/PPP.
If you’re curious what the difference between my projections and Dom’s were over the course of an 82-game season, you can multiply those per-GP numbers by 82 to get the results. Across all players, Dom averaged 0.026 goals, 0.447 assists, and 0.250 points closer to their actual 82-game paces than I did. G + A does not equal PTS here because I’m using absolute values, meaning Dom could have been below the actual number and I could have been higher, but the difference between our numbers and the actual is what is counted. For instance if I was 0.100 points per game higher on a certain player and Dom was 0.100 points per game lower, our difference would come out to the same number; however I could actually be low on goals per game and high on assists per game and the difference in assists per game could be greater than points per game.
On the whole, I’m very pleased with how my projections fared this season and how they stack up against one of the best in the biz. As anyone who has followed my content before will know, I regard everything I do with regards to fantasy hockey through a lens of continuous improvement, and checking my work for accuracy is an important step for me as I evaluate areas for improvement as I head into my third season of providing projections. I’m excited to improve on this baseline next season and my objective is to quite simply to provide the best fantasy hockey projections available anywhere.
That’s all for this one folks, I hope you had as much fun reading it as I had writing it! Make sure you follow Apples & Ginos on Twitter and join the Apples & Ginos Discord server for more content and to ask any fantasy hockey questions you may have.
Thanks for reading, you are appreciated!
Nate
Soundtrack to my writing: Still – Sophia James & Planet Her – Doja Cat

One thought on “Vetting My Projections”