Mark Barbour (@18sktrs, patreon.com/18skaters)
In my first few articles here at Apples & Ginos I’m looking at how statistics that are relevant to fantasy hockey are distributed among NHL skaters based on age. This type of data can help us set reasonable expectations about skater performance while also helping us identify which skaters could be about to hit their prime. This article looks at the relationship between a skater’s age and his shots on goal.
How Were Shots Distributed By Age In 2021-22?
The shots data from last season are plotted below. Each square in the plot represents a skater, and its location shows the skater’s age as well as his total shots for the season. The squares will overlap when skaters who are the same age register the same number of shots, and when that happens the squares get darker. The effect is essentially a “heatmap” where the dark areas represent the highest density of skaters.

Comments on this plot:
- In a previous article here at Apples & Ginos I looked at the distribution of goals based on age. As you might expect, the data for shots look similar to the data for goals – there is a peak for skaters in their mid-20s and a noticeable decline as skaters age into their 30s.
- As we saw with the goals data, Alex Ovechkin is an outlier at age-36. Last season he had the second most shots in the NHL with 334, trailing only the Auston Matthews (age-24). Notice that there’s another age-36 skater who pulled away from the pack last season – that’s Patrice Bergeron who took 293 shots.
- An interesting observation about this plot: Roman Josi had the most shots on goal for an age-31 skater. His 281 shots were more than the total registered by any skater aged 27-30. That’s remarkable given that Roman Josi is a defenseman. Can he do it again?
How Were Shots Distributed By Age From 2014-19?
The time period of 2014-19 represents the five most recent full-length seasons prior to COVID-19 affecting the NHL schedule. What does this historical data look like?
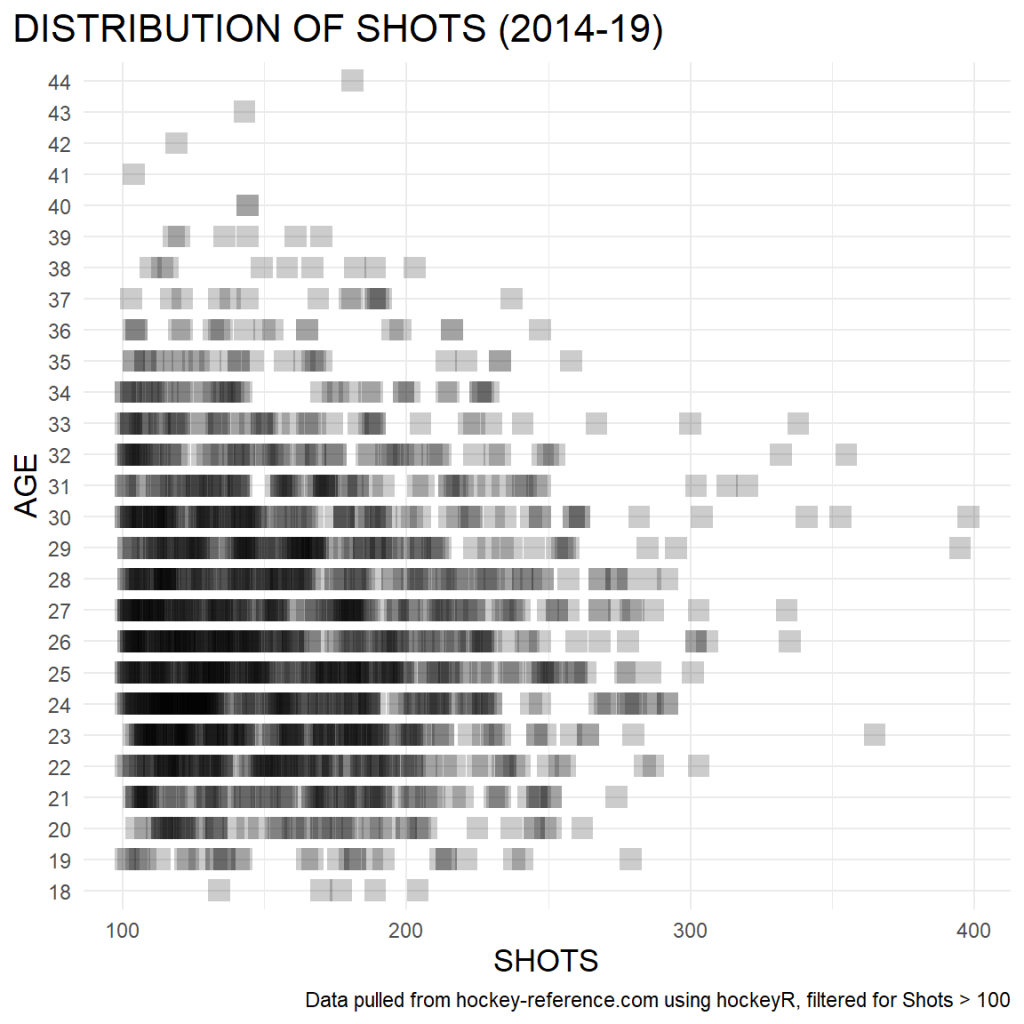
Comments on this plot:
- Mostly more of the same here: a peak for skaters in their mid-20s. The difference is that there were fewer skaters in their mid-30s who put up a large number of shots (and keep in mind that Alex Ovechkin accounts for five of those data points around age-30).
- There was not a single age-36(+) skater who put up at least 250 shots during this time period. With that in mind, is it reasonable to expect both Bergeron and Ovechkin to repeat their performances from last season as they head into their age-37 seasons?
Just Show Me Some Numbers!
Maybe scatter plots that look like heatmaps aren’t your thing. Perhaps you want some simple numbers that tell you what’s going on here. OK, here’s a count of the number of skaters who had at least 250 shots in a season, separated by age.
AGE DISTRIBUTION OF 250+ SHOTS
| AGE | COUNT |
|---|---|
| 19 | 1 |
| 20 | 2 |
| 21 | 3 |
| 22 | 6 |
| 23 | 5 |
| 24 | 11 |
| 25 | 12 |
| 26 | 7 |
| 27 | 12 |
| 28 | 8 |
| 29 | 7 |
| 30 | 9 |
| 31 | 3 |
| 32 | 4 |
| 33 | 3 |
| 35 | 1 |
The End Of The Article
That’s all for now. I’ll be back soon with another article examining historical data.
