Mark Barbour (@18sktrs, patreon.com/18skaters)
In my first few articles here at Apples & Ginos I’ve been looking at how the statistics that are relevant to fantasy hockey are distributed among NHL skaters based on age. This type of analysis can be helpful when projecting future skater performance. We can use it to identify skaters who could be about to hit their prime, or to identify skaters who are likely to see a decline.
This article is my last one discussing the age distribution of statistics. It looks at the relationship between a skater’s age and his blocked shots.
How Were Blocks Distributed By Age In 2021-22?
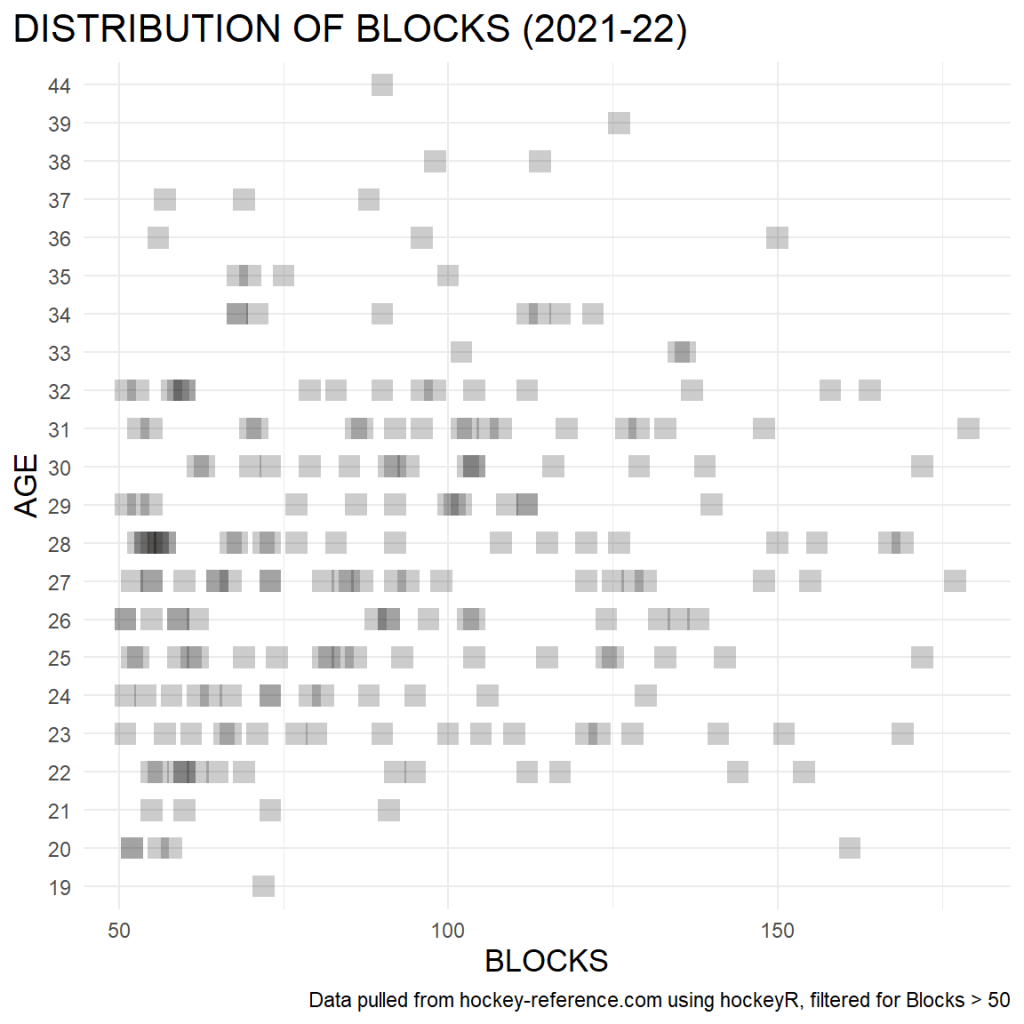
The blocks data from last season are plotted below. Each square in the plot represents a skater, and its location shows the skater’s age as well as his total blocks for the season. The squares will overlap when skaters who are the same age register the same number of blocks, and when that happens the squares get darker. The effect is essentially a “heatmap” where the dark areas represent the highest density of skaters.
Comments on this plot:
- The distribution is fairly “flat” for skaters in their mid-20s to their early-30s.
- Moritz Seider was in his age-20 season last year. Now that you know that, you can probably guess which square in this plot belongs to him. He registered 161 blocks last season. That was the ninth highest total in the NHL, and crushed every other under-22 skater.
- Looking at the age-22 skaters, that group was led by Noah Dobson. My perception is that people focus on Dobson’s offensive potential (in particular his emerging role on the power play) while overlooking his blocked shots. Noah Dobson blocked 154 shots last year, and that was the 13th highest total in the NHL. Give him another 2-3 minutes of time-on-ice as he enters his prime and he could soon be a very good defenseman in fantasy hockey.
- Curious about which skaters who played at a forward positions had the most blocks last year? It was Nick Bonino (age-33 season), Anze Kopitar (age-34 season), and Joe Pavelski (age-37 season). Those are some older skaters.
- What happens if we look at a larger sample of data?
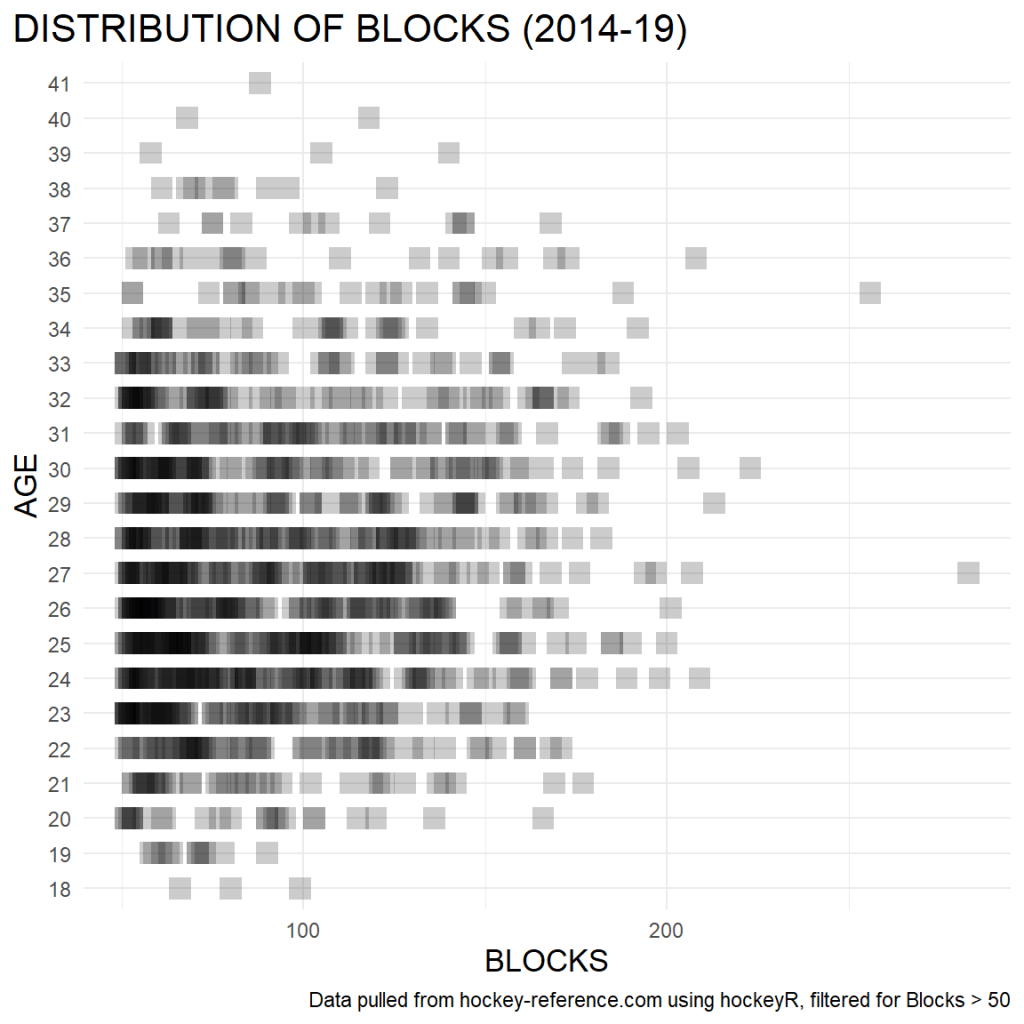
How Were Blocks Distributed By Age From 2014-19?
The time period of 2014-19 represents the five most recent full-length seasons prior to COVID-19 affecting the NHL schedule. What does this historical data look like?
Comments on this plot:
- In this case, the larger sample of data seems to align with the smaller sample taken from last season. There is no peak for skaters in their mid-20s, and skaters in their 30s continued to be among the top shot-blockers in the NHL.
- Of all the statistics that I’ve looked at in this series of articles this is the one that seems most likely to be sustained as a skater ages into his 30s.
Just Show Me Some Numbers!
Maybe scatter plots that look like heatmaps aren’t your thing. Perhaps you want some simple numbers that tell you what’s going on here. OK, here’s a count of the number of skaters who had at least 150 blocks in a season, separated by age.AGE DISTRIBUTION OF 150+ BLOCKS
| AGE | COUNT |
|---|---|
| 20 | 1 |
| 21 | 2 |
| 22 | 5 |
| 23 | 3 |
| 24 | 11 |
| 25 | 11 |
| 26 | 6 |
| 27 | 10 |
| 28 | 7 |
| 29 | 9 |
| 30 | 11 |
| 31 | 9 |
| 32 | 10 |
| 33 | 6 |
| 34 | 4 |
| 35 | 3 |
| 36 | 5 |
| 37 | 1 |
Brief Summary
At the risk of oversimplifying things, here are a few rough guidelines for projecting future skater performance.
- Skaters in their mid-20s were among the top producers across all statistics.
- The age at which skaters started to regularly appear among the top producers was age-22. In most cases it will be prudent to have modest expectations for an age-20 rookie.
- The distribution of goals and shots showed the earliest decline based on age, particularly after age-30.
- The distribution of assists did not decline quite as quickly, though there was some drop-off after age-32.
- The distribution of hits showed a decline after age-30, though many of the top hitters in the NHL last season were in their 30s.
- The distribution of blocks showed the slowest rate of decline, with skaters in their 30s being among the top shot-blockers in the league.
- Generally speaking, there was a decline across all statistics for skaters who were age-34 or older.
- There will be outliers! These guidelines are not laws of nature, and some skaters will defy them. Alex Ovechkin is a real person doing unreal things when it comes to scoring goals in the NHL.
- Having said that, when drafting a fantasy hockey team I avoid rookies and I heavily fade skaters who are age-34 or older. A skater who is closer to age-24 is much more likely to get my attention during the draft.
The End Of The Article
That’s all for now. Hopefully you found this series of articles useful for thinking about how to assemble your fantasy hockey team. I’ll be back soon with another article that will examine fresh data from this season.
