Hello everyone and welcome in for another article, this one examining my 2022/23 projections to see how accurately I was able to predict player performance for this past season. If you haven’t seen them yet, my 2023/24 projections are now live and free for all to use to dominate their fantasy drafts this season. If you’re interested in discussing these projections in detail, I’d invite you to join the Apples & Ginos Discord Server and head to the #skater-projections channel where I will field any and all questions about the inputs and assumptions that went into generating them.
But why should you be interested in these projections? Why use them versus any other resource widely available? Well, last year I performed some analysis vetting my projections by comparing them to Dom Luszczyszyn from the Athletic. If you’re unfamiliar with Dom’s work, he is widely considered one of the smartest people in hockey and he uses models to consistently win money betting on hockey games.
I figured rather than simply comparing my projections against the players’ season-end statistics, I could compare how far off I was on average versus how far off Dom was on average and see if I was even in the same ballpark. I compared my projections for each player against their actual statistics and found the absolute difference for each statistic, whether I was higher or lower than the actual. I did this for each statistic that both Dom and I projected, which was goals, assists, points, power play points, shots on goal, hits, blocks, and penalty minutes. To ensure I was comparing apples to apples, I did this on a per game played and per 60 minutes of ice time basis rather than an overall finish. Here are the results:
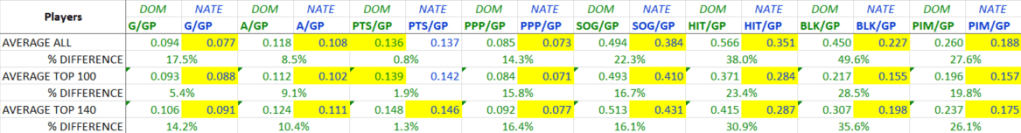
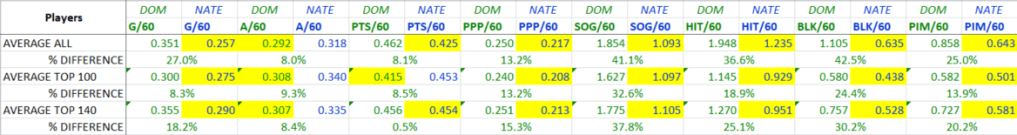
I’ve highlighted the lesser (and therefore closer to the actual player finish) number in yellow for each statistic. Dom’s numbers are all in green and mine are all in blue as you can see. The % difference number shows the difference between Dom and I for each statistic (regardless of who was closer to the actual player finish). I checked these values for all of the players that we both projected, the top 100 players in my projections, and the top 140. These are largely arbitrary numbers but obviously the top 100 players are likely the most fantasy-relevant, while I chose 140 as in a standard 10-team Yahoo league most teams would be rostering 14 skaters (10 x 14 = 140).
You can draw your own conclusions from the numbers above, but essentially Dom and I were quite close on points projections, I was able to outperform him on goals projections, while assists depends on whether you view the end of season stats on a per GP or per 60 minutes TOI basis. I am proud to have swept the other categories across both comparisons.
On the whole, I’m very pleased with how my projections fared this past season and how they stack up against one of the best in the biz. As anyone who has followed my content before will know, I regard everything I do with regards to fantasy hockey through a lens of continuous improvement, and checking my work for accuracy is an important step for me as I evaluate how I can get better. I’ve made some tweaks to my process this year with the aim of improving even more; my objective is to quite simply to provide the best fantasy hockey projections available anywhere.
Thanks for reading, you are appreciated!
Nate
